
Hardening and dashboard scrape
Hardening and dashboard scrape
HOST-APU-01 (2026-09-15 fabric + APU review) closed the listen surface that the Sep 2026 anycast work did not touch. Grafana, Prometheus, node_exporter and unbound-exporter used to listen on every address. apu01 also terminates wg0 (172.16.75.1/24), so those sockets were reachable from every wg-home peer without crossing the core firewall.
After the bind change, LAN :9090 and :9100 connection-refuse. The hp02 dashboard still needs those numbers, so it scrapes over SSH as bodo to vlan89 and talks to 127.0.0.1 on the box. It never re-exposes those ports.
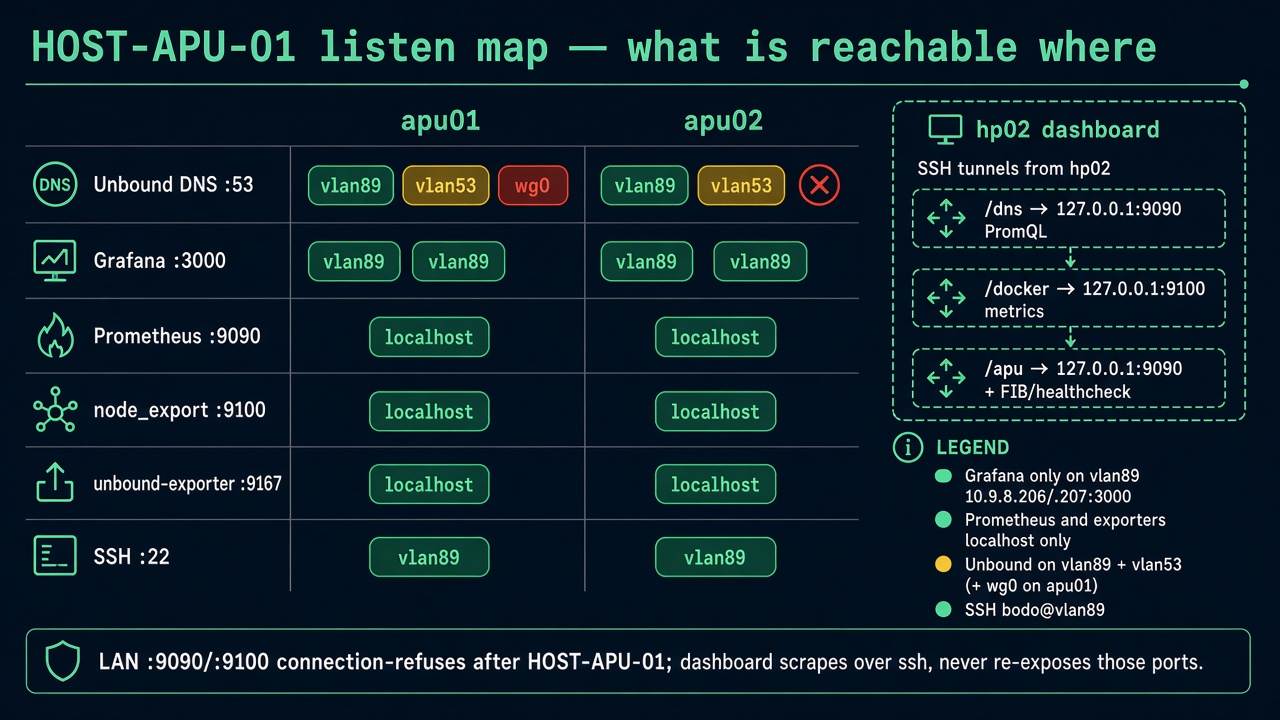
Listen map (after HOST-APU-01)
| Service | apu01 | apu02 |
|---|---|---|
Unbound DNS :53 |
vlan89 + vlan53 + wg0 + anycast on lo — not 0.0.0.0 |
vlan89 + vlan53 + anycast on lo — not 0.0.0.0 |
Grafana :3000 |
vlan89 only (10.9.8.206) | vlan89 only (10.9.8.207) |
Prometheus :9090 |
localhost | localhost |
node_exporter :9100 |
localhost | localhost |
unbound-exporter :9167 |
localhost | localhost |
SSH :22 |
vlan89 (bodo, pubkey) |
vlan89 (bodo, pubkey) |
Unbound ACL is fabric prefixes (10.9.8.0/24, 10.53.53.0/24, 192.168.32.0/19, 192.168.53.0/24, 172.16.62.0/24, 172.16.75.0/24), not all of RFC1918. Reload keeps an old 0.0.0.0:53 socket; a restart is what actually drops it.
On apu01 only, nftables table inet host_apu_01 is extra belt-and-braces: allow Grafana/metrics on lo and enp2s0 (vlan89), drop tcp/3000,9090,9100,9167 on every other ingress (wg0 and vlan53). Persist via include "/etc/nftables.d/host-apu-01.nft" in /etc/nftables.conf and nftables.service enabled. nft -f alone dies at reboot; enable without the include would load Debian’s flush-ruleset stub and wipe the live table.
Other HOST-APU-01 items: drop bodo from group lxd (membership is de-facto root); snap remove lxd if unused; apu02 sysctl drop-in (accept_redirects=0, send_redirects=0, rp_filter=2). Never run lxc / lxc list on these boxes — on Ubuntu 24.04 /usr/sbin/lxc is the lxd-installer stub and installs the snap.
Handover: mikrotik-workspace/tools/handover/2026-09-15-apu-hardening.sh (dry-run from hp02; --apply on the APU as root, with --dns / --nftables as needed).
How hp02 still sees the boxes
flowchart LR
  subgraph hp02["hp02 dashboard :8787"]
    DNS["/dns  REQ-D5"]
    DOCKER["/docker  REQ-DF5"]
    APU["/apu  REQ-DASH32"]
    SITES["/sites"]
  end
  DNS -->|"ssh bodo@10.9.8.206/.207"| P["127.0.0.1:9090 PromQL"]
  DOCKER -->|"ssh bodo@vlan89"| N["127.0.0.1:9100 /metrics"]
  APU -->|"one ssh round trip"| BOX["FIB, lo anycast, timer, Prom on localhost"]
  SITES --> INV[inventory / live probes]
| Requirement | Page | What it scrapes | What it must not do |
|---|---|---|---|
| REQ-D5 | /dns |
One SSH per APU to vlan89; remote helper queries http://127.0.0.1:9090 for the existing PromQL (Unbound + node). Grafana links stay on vlan89. |
Must not scrape a LAN :9090 URL. That path refuses, and /dns used to paint PROM DOWN while Unbound was answering 9/9. |
| REQ-DF5 | /docker |
One SSH, curl http://127.0.0.1:9100/metrics on the box. APUs are kind: node_exporter (system pulse only — no Docker). A leftover LAN node_url is ignored when ssh is set. |
Must not scrape vlan89/vlan53 :9100. That painted apu01/apu02 red (Connection refused) while the boxes were up. |
| REQ-DASH32 | /apu |
Same SSH path: default route, OSPF route count, nexthop mode, 10.53.53.53/32 on lo, healthcheck --status / timer / journal, a smaller Unbound Prom set. Plus core REST (ECMP + OSPF/BFD) and UDP probes. |
Does not act; does not read root-only frr.conf / nft. |
SSH details that matter for the poller: user bodo, no sudo, ssh -n / stdin closed so apu01 Defaults use_pty cannot hang the dashboard. Fail-soft: SSH failure is prometheus unreachable / status: error, never an exception — probes still run.
Dashboard pages to open
| Path | Role |
|---|---|
/apu |
Anycast arms, self-heal, blackhole vs withdrawn vs healthy |
/dns |
Unbound QPS, cache, rcodes — Prom over SSH |
/docker |
APU load/mem from node_exporter over SSH (and Docker hosts elsewhere) |
/sites |
Site / inventory view of the same two boxes |
Grafana remains the on-box UI: http://10.9.8.206:3000/ and http://10.9.8.207:3000/. Prometheus and the exporters have no LAN URL after HOST-APU-01; do not add one back so the dashboard can “just HTTP”.